A constant claim by opponents of right-to-work, whether it be from the AFL-CIO, state Democratic legislators or the president, is that income is lower in right-to-work states. But these naysayers are blinded to a paycheck reality: the cost of living.
Having a larger paycheck doesn’t matter much if you can’t purchase as much with it. Adjusting for per-capita personal income — a standard measure of a state’s wealth — the difference between right-to-work and non-right-to-work states disappears.
Consider Connecticut, the state with the highest per-capita personal income. A dollar just doesn’t buy as much in Connecticut as it does in Michigan.
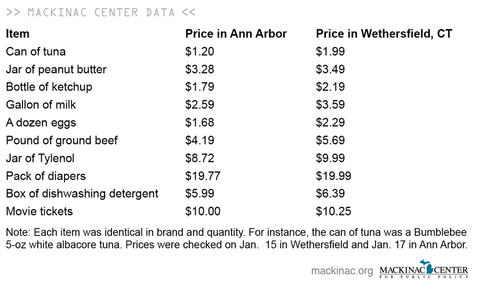
To highlight how disparate the cost-of-living can be, I had a friend explore a megastore outside of Hartford to look at prices for some common consumer goods. I had another friend scan prices on the same goods in Ann Arbor, a city roughly the same size as Hartford. In every single instance, the price of goods was more expensive in Connecticut.

On top of the added cost of goods, Connecticut levies a 6.35 percent sales tax compared to Michigan’s 6 percent sales tax.
A look at state average prices for other items shows a similar result. According to GasBuddy.com, on Jan. 18, 2013, a gallon of gas costs $3.658 in Connecticut and $3.306 in Michigan. (Connecticut’s price includes a 6.125 cent higher excise tax than Michigan’s price.)
A typical home in Connecticut costs $334,000. The Michigan statewide average is $110,633.
In other words, a dollar gets you more in Michigan.
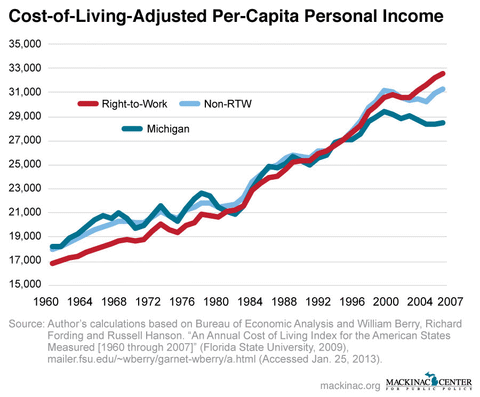
In fact, when adjusting for the cost-of-living, people in right-to-work states have higher incomes than in non-right-to-work states. To calculate this adjusted per-capita personal income, I used a state-by-state cost of living index available from political scientists Dr. William Berry, Dr. Richard Fording and Dr. Russell Hanson. Their index values adjust for cost-of-living in every state from 1960 to 2007.
When converting the personal income figures for all 50 states to the value of Michigan dollars in 2000, right-to-work states have 4.1 percent higher per-capita personal incomes than non-right-to-work states. And they have 14.0 percent higher PCPI than Michigan.
Adjusting to cost-of-living also changes the lists of states with the highest and lowest incomes. Natural-resources rich Wyoming becomes the second-wealthiest state and Virginia, Florida and Texas make it to the top 10. Of the 22 right-to-work states that existed in 2007, only three were in the the bottom 15 — Mississippi, Utah and Idaho.
The bigger bang-for-your-buck makes all the difference in real consumer choices.

It’s understandable that this hasn’t sunk into the common understanding. It was only in 2003 that right-to-work states overcame non-right-to-work states in per-capita personal income. And even then there is a wide difference among right-to-work states, meaning that there are plenty of right-to-work states with lower average incomes than some non-right-to-work states and vice versa.
In addition to higher incomes, right-to-work states also added more jobs and have lower unemployment. Since 2001, right-to-work states added a net 1.7 million jobs to their payrolls — this while non-right-to-work states lost 2.1 million jobs. In addition, the unemployment rate in right-to-work states is a full percentage point lower than non-right-to-work states. Even during a tough decade, right-to-work states improved while non-right-to-work states did not.
Given the stronger economies, it’s not surprising that right-to-work states attract people from non-right-to-work states. There’s a lot of moving in and moving out of a state in any one period of time, but in just the past two years a net 400,000 people moved from non-right-to-work to right-to-work states. That’s like the entire city of Cleveland packing up and heading to greener pastures.
Those high-income states tend to be the states that shed the most people. New York, Illinois, New Jersey and Connecticut top the list. One explanation may be that, like the high-paying union jobs in Michigan, the state may have some good work — if you can get it. Workers tend to find opportunity elsewhere.
Right-to-work states have been gaining people and gaining income. And when adjusting for cost-of-living, these states also have higher incomes.
|

Right-to-Work States Have Higher Incomes
When adjusted for cost-of-living
A constant claim by opponents of right-to-work, whether it be from the AFL-CIO, state Democratic legislators or the president, is that income is lower in right-to-work states. But these naysayers are blinded to a paycheck reality: the cost of living.
Having a larger paycheck doesn’t matter much if you can’t purchase as much with it. Adjusting for per-capita personal income — a standard measure of a state’s wealth — the difference between right-to-work and non-right-to-work states disappears.
Consider Connecticut, the state with the highest per-capita personal income. A dollar just doesn’t buy as much in Connecticut as it does in Michigan.
To highlight how disparate the cost-of-living can be, I had a friend explore a megastore outside of Hartford to look at prices for some common consumer goods. I had another friend scan prices on the same goods in Ann Arbor, a city roughly the same size as Hartford. In every single instance, the price of goods was more expensive in Connecticut.
On top of the added cost of goods, Connecticut levies a 6.35 percent sales tax compared to Michigan’s 6 percent sales tax.
A look at state average prices for other items shows a similar result. According to GasBuddy.com, on Jan. 18, 2013, a gallon of gas costs $3.658 in Connecticut and $3.306 in Michigan. (Connecticut’s price includes a 6.125 cent higher excise tax than Michigan’s price.)
A typical home in Connecticut costs $334,000. The Michigan statewide average is $110,633.
In other words, a dollar gets you more in Michigan.
In fact, when adjusting for the cost-of-living, people in right-to-work states have higher incomes than in non-right-to-work states. To calculate this adjusted per-capita personal income, I used a state-by-state cost of living index available from political scientists Dr. William Berry, Dr. Richard Fording and Dr. Russell Hanson. Their index values adjust for cost-of-living in every state from 1960 to 2007.
When converting the personal income figures for all 50 states to the value of Michigan dollars in 2000, right-to-work states have 4.1 percent higher per-capita personal incomes than non-right-to-work states. And they have 14.0 percent higher PCPI than Michigan.
Adjusting to cost-of-living also changes the lists of states with the highest and lowest incomes. Natural-resources rich Wyoming becomes the second-wealthiest state and Virginia, Florida and Texas make it to the top 10. Of the 22 right-to-work states that existed in 2007, only three were in the the bottom 15 — Mississippi, Utah and Idaho.
The bigger bang-for-your-buck makes all the difference in real consumer choices.
It’s understandable that this hasn’t sunk into the common understanding. It was only in 2003 that right-to-work states overcame non-right-to-work states in per-capita personal income. And even then there is a wide difference among right-to-work states, meaning that there are plenty of right-to-work states with lower average incomes than some non-right-to-work states and vice versa.
In addition to higher incomes, right-to-work states also added more jobs and have lower unemployment. Since 2001, right-to-work states added a net 1.7 million jobs to their payrolls — this while non-right-to-work states lost 2.1 million jobs. In addition, the unemployment rate in right-to-work states is a full percentage point lower than non-right-to-work states. Even during a tough decade, right-to-work states improved while non-right-to-work states did not.
Given the stronger economies, it’s not surprising that right-to-work states attract people from non-right-to-work states. There’s a lot of moving in and moving out of a state in any one period of time, but in just the past two years a net 400,000 people moved from non-right-to-work to right-to-work states. That’s like the entire city of Cleveland packing up and heading to greener pastures.
Those high-income states tend to be the states that shed the most people. New York, Illinois, New Jersey and Connecticut top the list. One explanation may be that, like the high-paying union jobs in Michigan, the state may have some good work — if you can get it. Workers tend to find opportunity elsewhere.
Right-to-work states have been gaining people and gaining income. And when adjusting for cost-of-living, these states also have higher incomes.
Michigan Capitol Confidential is the news source produced by the Mackinac Center for Public Policy. Michigan Capitol Confidential reports with a free-market news perspective.
More From CapCon