Commentary
Don’t Confuse Cold Weather Snap for Climate Change
Swings in temperatures have always happened in Michigan
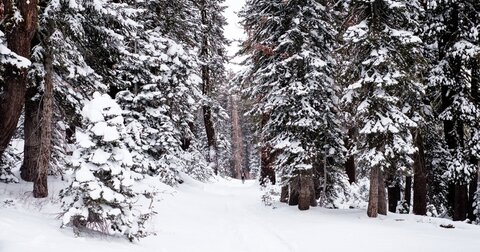
PxHere
In her Feb. 12 State of the State speech, Gov. Whitmer claimed that climate change-induced extreme temperature swings were already endangering the health and well-being of Michigan residents. But a quick look at the science and at past temperature records indicates the governor’s warning may not be a cause for concern.
In her State of the State speech, Gov. Whitmer highlighted the drastic changes in temperatures that Michigan and other Midwest states experienced in late January and early February:
Two weeks ago we had wind chills: 50 below zero. Last week it was over 50 above. That’s a 100 degree swing – and a reminder that climate change and extreme weather are already putting Michiganders at risk. As a state, we must take that risk seriously. We cannot and will not wait to act.
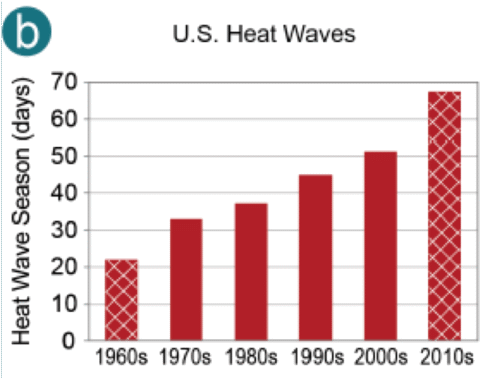
Figure 1: 2018 Fourth National Climate Assessment - Climate Change Indicators - U.S. Heat Waves
Unfortunately, the governor’s commitment to act misses the mark because her example confuses weather for climate and ignores the fact these extreme weather events are actually trending downward in both frequency and intensity.
Some will protest, claiming — as the governor did — that climate science absolutely proves that climate change-induced extreme weather events are an increasing threat.
To help readers better understand where some of those claims come from, the Fourth National Climate Assessment's “Climate Change Indicators” page contained a graph of U.S. heat waves showing how, from 1960 to the 2010s, heat waves have increased in number.
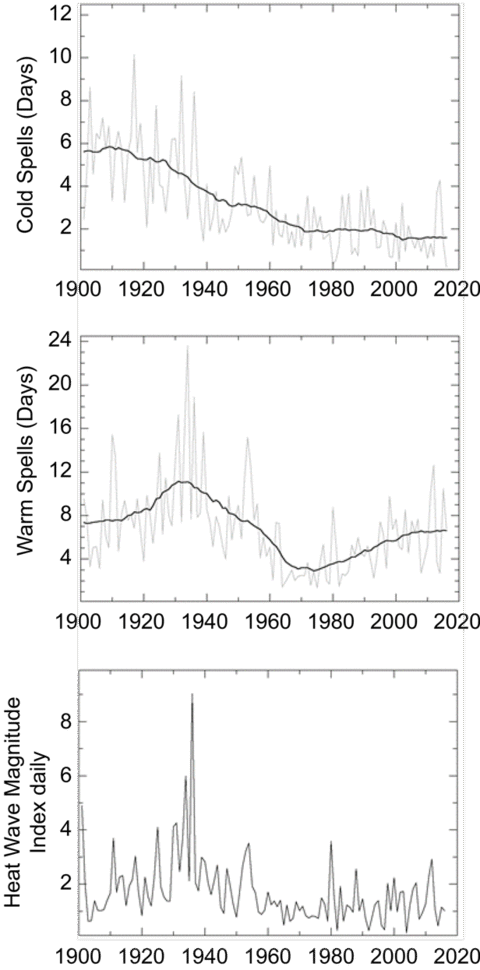
Figure 2: 2017 Climate Science Special Report, Chapter 6: Temperature Changes in the U.S. - Warmest Temperatures
But a Feb. 14 post on The Deplorable Climate Science Blog notes the value of choosing 1960 as a starting point in the 2018 study graph. It seems the authors and editors of the Fourth National Climate Assessment may have overlooked information from their earlier work.
The blog’s author, noted climate change skeptic and blogger, Tony Heller, pointed to the 2017 edition of the Climate Science Special Report, which included a similar set of graphs, showing temperature records all the way back to 1900. Those graphs are worth revisiting because they reveal that heat waves, or using the less exciting term, “warm spells,” seen in the 1930s were warmer and extended over longer periods than those experienced since 1960. Looking at these two studies — from the same government website — it seems that the dates you pick can make a world of difference in what your findings suggest.
Dr. Judith Curry, president of Climate Forecast Applications Network and former chair of the School of Earth and Atmospheric Sciences at the Georgia Institute of Technology, supported the notion that weather extremes are on a decreasing trend. In her Feb. 6 testimony to the House Committee on Natural Resources, Dr. Curry noted, “Many extreme weather events have documented relationships with natural climate variability; in the U.S., extreme weather events (e.g., droughts, heat waves and hurricanes) were significantly worse in the 1930s and 1950s.”
The remaining graph from the 2017 CSSR, depicting a higher number of cold spells in the early-to-mid 1900s, fits well with observations made by Dr. Roy Spencer, principal research scientist at the University of Alabama in Huntsville and former senior scientist for climate studies at NASA’s Marshall Space Flight Center. In his post, Dr. Spencer asks, “If the polar vortex is due to global warming, why are U.S. cold waves decreasing?”
Dr. Spencer throws cold water on the idea that climate change is increasing the number and severity of cold waves, like the recent polar vortex event. He provides another graph from his coworker Dr. John Christy showing a significant decline in cold waves from the late 19th century to today. He also helpfully identifies the lack of evidence "supporting the claim that decreasing Arctic sea ice in recent decades is causing more frequent displacement of cold winter air masses into the eastern U.S., at least through the winter of 2017-18.” Spencer points out that the trend in the number and duration of these cold weather events is “markedly downward in the most recent 40 years.”
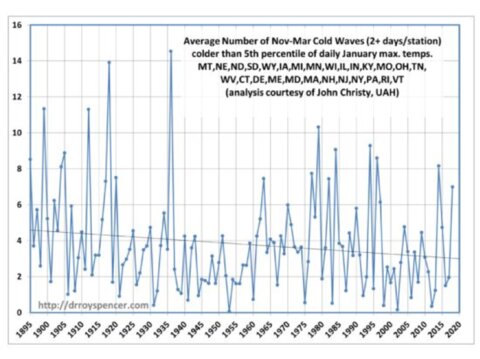
Figure 3: Average number of Nov-Mar Cold Waves
So, Gov. Whitmer correctly noted an extreme swing in the temperatures that Michigan experienced from the closing days of January to the opening days of February. But, as is clear from historical data, the nation used to experience even worse extremes. So, contrary to Gov. Whitmer’s remarks, if there’s a connection between climate change and extreme temperature swings, it’s one that goes in the opposite direction of what she implied. In other words, based on the historical record, it’s not at all clear how “act[ing]” on climate change would produce fewer extreme temperature swings.
Gov. Whitmer deserves commendation for her concerns about the impacts extreme temperatures may have on the state. But her confusion of weather for climate cannot be disregarded. Basing the state’s energy and environmental policies in that confusion would be a mistake.
The cold weather and strained electricity and natural gas infrastructure across the Midwest indicate that the best course of action to respond to temperature swings is to ensure that competitively sourced, consistent energy supplies are ready and available for Michigan residents. A steady supply of affordable, reliable energy is the best way to properly prepare Michiganders for future cold snaps, even if they occur less frequently these days.
 |
|

 Like CapCon on Facebook
 Follow CapCon on X
Don’t Confuse Cold Weather Snap for Climate Change
Swings in temperatures have always happened in Michigan
In her Feb. 12 State of the State speech, Gov. Whitmer claimed that climate change-induced extreme temperature swings were already endangering the health and well-being of Michigan residents. But a quick look at the science and at past temperature records indicates the governor’s warning may not be a cause for concern.
In her State of the State speech, Gov. Whitmer highlighted the drastic changes in temperatures that Michigan and other Midwest states experienced in late January and early February:
Figure 1: 2018 Fourth National Climate Assessment - Climate Change Indicators - U.S. Heat Waves
Unfortunately, the governor’s commitment to act misses the mark because her example confuses weather for climate and ignores the fact these extreme weather events are actually trending downward in both frequency and intensity.
Some will protest, claiming — as the governor did — that climate science absolutely proves that climate change-induced extreme weather events are an increasing threat.
To help readers better understand where some of those claims come from, the Fourth National Climate Assessment's “Climate Change Indicators” page contained a graph of U.S. heat waves showing how, from 1960 to the 2010s, heat waves have increased in number.
Figure 2: 2017 Climate Science Special Report, Chapter 6: Temperature Changes in the U.S. - Warmest Temperatures
But a Feb. 14 post on The Deplorable Climate Science Blog notes the value of choosing 1960 as a starting point in the 2018 study graph. It seems the authors and editors of the Fourth National Climate Assessment may have overlooked information from their earlier work.
The blog’s author, noted climate change skeptic and blogger, Tony Heller, pointed to the 2017 edition of the Climate Science Special Report, which included a similar set of graphs, showing temperature records all the way back to 1900. Those graphs are worth revisiting because they reveal that heat waves, or using the less exciting term, “warm spells,” seen in the 1930s were warmer and extended over longer periods than those experienced since 1960. Looking at these two studies — from the same government website — it seems that the dates you pick can make a world of difference in what your findings suggest.
Dr. Judith Curry, president of Climate Forecast Applications Network and former chair of the School of Earth and Atmospheric Sciences at the Georgia Institute of Technology, supported the notion that weather extremes are on a decreasing trend. In her Feb. 6 testimony to the House Committee on Natural Resources, Dr. Curry noted, “Many extreme weather events have documented relationships with natural climate variability; in the U.S., extreme weather events (e.g., droughts, heat waves and hurricanes) were significantly worse in the 1930s and 1950s.”
The remaining graph from the 2017 CSSR, depicting a higher number of cold spells in the early-to-mid 1900s, fits well with observations made by Dr. Roy Spencer, principal research scientist at the University of Alabama in Huntsville and former senior scientist for climate studies at NASA’s Marshall Space Flight Center. In his post, Dr. Spencer asks, “If the polar vortex is due to global warming, why are U.S. cold waves decreasing?”
Dr. Spencer throws cold water on the idea that climate change is increasing the number and severity of cold waves, like the recent polar vortex event. He provides another graph from his coworker Dr. John Christy showing a significant decline in cold waves from the late 19th century to today. He also helpfully identifies the lack of evidence "supporting the claim that decreasing Arctic sea ice in recent decades is causing more frequent displacement of cold winter air masses into the eastern U.S., at least through the winter of 2017-18.” Spencer points out that the trend in the number and duration of these cold weather events is “markedly downward in the most recent 40 years.”
Figure 3: Average number of Nov-Mar Cold Waves
So, Gov. Whitmer correctly noted an extreme swing in the temperatures that Michigan experienced from the closing days of January to the opening days of February. But, as is clear from historical data, the nation used to experience even worse extremes. So, contrary to Gov. Whitmer’s remarks, if there’s a connection between climate change and extreme temperature swings, it’s one that goes in the opposite direction of what she implied. In other words, based on the historical record, it’s not at all clear how “act[ing]” on climate change would produce fewer extreme temperature swings.
Gov. Whitmer deserves commendation for her concerns about the impacts extreme temperatures may have on the state. But her confusion of weather for climate cannot be disregarded. Basing the state’s energy and environmental policies in that confusion would be a mistake.
The cold weather and strained electricity and natural gas infrastructure across the Midwest indicate that the best course of action to respond to temperature swings is to ensure that competitively sourced, consistent energy supplies are ready and available for Michigan residents. A steady supply of affordable, reliable energy is the best way to properly prepare Michiganders for future cold snaps, even if they occur less frequently these days.
Michigan Capitol Confidential is the news source produced by the Mackinac Center for Public Policy. Michigan Capitol Confidential reports with a free-market news perspective.
More From CapCon