Last week, the University of Michigan School of Public Health released a series of seven Powerpoint slides that attempt to show that Gov. Gretchen Whitmer’s recent lockdown policies resulted in “2,800 lives saved.” The analysis relies on a predictive simulation built on several questionable assumptions, and the slides offer few details about how the estimate was generated. But one thing is clear: This report does not measure the impact of the governor’s orders, but simply assumes that they worked as intended. And even if these assumptions were true and the report had a perfectly tuned predictive model, its findings are exaggerated.
The U-M analysis tries to predict how many cases did not occur in Michigan due to the lockdown orders put in place in mid-November, which closed indoor dining, high schools and colleges, movie theaters, bowling alleys and more. Through its modeling, the analysis estimates there would have been 109,000 more positive COVID tests from Nov. 15 to Jan. 8 but for the so-called pause. This figure is then multiplied by the state’s case fatality rate for COVID —2.6% — leading to an estimated 2,800 lives saved.
But the 2,800 figure is overstated, as the lead author of the analysis later admitted. The study should not have used the overall case fatality rate of 2.6%, which includes the state’s entire experience with COVID and covers the early days of the pandemic, when doctors knew much less about how to effectively treat infected individuals. Instead, a more accurate estimate would use the case fatality rate experienced from Nov. 15 to Jan. 8. That rate is much lower, only about 1.8%. The resulting calculation would yield an estimate of 1,960 saved lives, based on the analysis’s simulation and assumptions. This one change reduces the reports estimate by 30%.
To their credit, when pressed on this by a Bridge Michigan reporter, the lead author of the analysis admitted this mistake and reran the numbers based on the 1.8% case fatality rate. The original slides were then edited, and a new version includes this more realistic estimate. Of course, it’s unlikely headlines will be changed as a result of this correction.
The 1,960 figure comes from a simulation model that assumes Gov. Whitmer’s second shutdown led to fewer contacts between people, and, hence, fewer cases and deaths. The model’s assumptions may or may not be true, but if they were accurate, they should match up with the actual data we have on COVID deaths.
If there were 1,960 fewer deaths between Nov. 15 and Jan. 8, that means there would be an average of 37 fewer deaths per day during that time. This equates to a reduction of approximately 27%. Such a large effect should easily be visible in Michigan’s data, especially when compared to that of nearby states, like Indiana and Ohio.
The actual data on daily COVID deaths do not show this, however. The graphic below illustrates this using data from the COVID Tracking Project. Even though Michigan’s neighboring states had different COVID policies and restrictions, Michigan had a similar death rate. Had Gov. Whitmer’s orders had as large of an effect as the U-M analysis claims, the state should have performed significantly better than these neighboring states. We didn’t — our daily death rate tracked closely with Indiana and nearly always exceeded Ohio’s.
There are more reasons to doubt the analysis’s assumption that Gov. Whitmer’s actions were solely responsible for the decrease in positive cases tracked by the state over this period. For example, state data provided by U-M show that the trend in daily new cases in Michigan started to decline before the “the pause” went into effect on Nov. 18. The seven-day average of new daily cases peaked on Nov. 14 and has fallen and remained below that level ever since.
Something other than “the pause” must explain this. This leaves open the possibility that cases would have continued to fall even without interventions. The U-M analysis is left claiming that cases fell at a faster rate than the downward pace they were already on.
Another factor that probably led to fewer positive cases being reported, which the analysis does not appear to have considered, is the significant drop in testing over the period. According to state data provided by U-M, Michigan was administering over 60,000 tests per day when “the pause” went into effect on Nov. 18. That number started to fall around Thanksgiving and steadily decreased until the new year, when the state was only conducting about 33,000 tests per day. That’s a 45% decrease.
Administering fewer tests typically means fewer known cases, and this could explain a lot of the decline in positive cases since “the pause” began. Data from the COVID Tracking Project shows that testing volumes and the number of cases track closely with each other. The decline in cases in Michigan from the end of November to the end of December closely tracks the decline in testing, as Graphic 2 illustrates.[1]
Another problem with U-M's simulation model is that it treats “the pause” as a singular, consistent policy. It wasn’t. Gov. Whitmer and Robert Gordon, former director of the state health department, regularly tweaked the policy and gradually allowed certain activities to resume over the period the U-M study analyzes. There were really three different "pauses,” one from Nov. 18 to Dec. 8, another from Dec. 9 to Dec. 20 and a third from Dec. 21 to Jan. 15.
The first pause outlawed indoor dining, group fitness classes and all amateur and youth organized sports, closed bowling alleys, stadiums, movie theaters, casinos and skating rinks, and prohibited in-person schooling at high schools, colleges, career and technical schools and trade schools. But starting Dec. 9, skating rinks and outdoor group exercise were permitted to reopen at limited capacity, and in-person classes at career and technical schools and trade schools was permitted. Then on Dec. 21, movie theaters, casinos, stadiums and bowling alleys were allowed to reopen at limited capacity, noncontact sports were permitted outdoors, and high schools and colleges could once again meet in person.
The fact that case counts continued their downward trend despite these policy changes challenges the basic assumption built into the U-M simulation: The restrictions put in place by “the pause” were what drove down case counts. Even when restrictions were relaxed, the study assumes those actions reduced case counts as effectively as the initial restrictions did. It’s as if no matter what the state did — whether imposing new restrictions or lifting them — all of it “worked” equally well.
A last reason to be skeptical of this analysis is that the University of Michigan’s School of Public Health is not a neutral third party for the purpose of assessing the impacts of the state’s COVID response. Experts at the school have been advising Gov. Whitmer on what policies to enact throughout the pandemic, at times sharing a stage with her at press conferences. These same experts may have been involved in the decision to initiate the second shutdown starting Nov. 18. People advising the state on what action to take have a strong interest in showing that the actions they recommended were successful.
Careful analysis of the impact of COVID-related policies are valuable, and researchers across the globe are trying different ways to estimate the results of these extraordinary governmental actions. This recent U-M analysis is not one of those, however. By relying on faulty assumptions and ignoring relevant and important factors that may have contributed to falling case counts, it fails to prove anything about whether the governor’s decision to ban certain activities was responsible for slowing the spread of COVID-19 in Michigan.
[1] The graph uses different units for population controls for tests (per million) and cases (per 100,000) simply to make the trend lines easier to read.
 |
|

 Like CapCon on Facebook
 Follow CapCon on X
No Proof ‘Pause’ Worked
U-M study exaggerates its own findings
Last week, the University of Michigan School of Public Health released a series of seven Powerpoint slides that attempt to show that Gov. Gretchen Whitmer’s recent lockdown policies resulted in “2,800 lives saved.” The analysis relies on a predictive simulation built on several questionable assumptions, and the slides offer few details about how the estimate was generated. But one thing is clear: This report does not measure the impact of the governor’s orders, but simply assumes that they worked as intended. And even if these assumptions were true and the report had a perfectly tuned predictive model, its findings are exaggerated.
The U-M analysis tries to predict how many cases did not occur in Michigan due to the lockdown orders put in place in mid-November, which closed indoor dining, high schools and colleges, movie theaters, bowling alleys and more. Through its modeling, the analysis estimates there would have been 109,000 more positive COVID tests from Nov. 15 to Jan. 8 but for the so-called pause. This figure is then multiplied by the state’s case fatality rate for COVID —2.6% — leading to an estimated 2,800 lives saved.
But the 2,800 figure is overstated, as the lead author of the analysis later admitted. The study should not have used the overall case fatality rate of 2.6%, which includes the state’s entire experience with COVID and covers the early days of the pandemic, when doctors knew much less about how to effectively treat infected individuals. Instead, a more accurate estimate would use the case fatality rate experienced from Nov. 15 to Jan. 8. That rate is much lower, only about 1.8%. The resulting calculation would yield an estimate of 1,960 saved lives, based on the analysis’s simulation and assumptions. This one change reduces the reports estimate by 30%.
To their credit, when pressed on this by a Bridge Michigan reporter, the lead author of the analysis admitted this mistake and reran the numbers based on the 1.8% case fatality rate. The original slides were then edited, and a new version includes this more realistic estimate. Of course, it’s unlikely headlines will be changed as a result of this correction.
The 1,960 figure comes from a simulation model that assumes Gov. Whitmer’s second shutdown led to fewer contacts between people, and, hence, fewer cases and deaths. The model’s assumptions may or may not be true, but if they were accurate, they should match up with the actual data we have on COVID deaths.
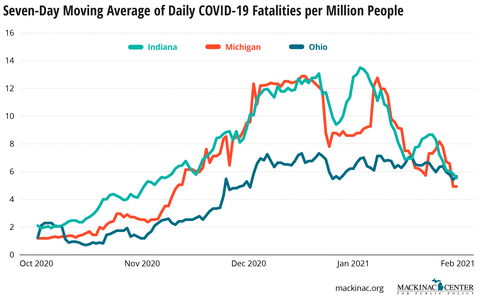
If there were 1,960 fewer deaths between Nov. 15 and Jan. 8, that means there would be an average of 37 fewer deaths per day during that time. This equates to a reduction of approximately 27%. Such a large effect should easily be visible in Michigan’s data, especially when compared to that of nearby states, like Indiana and Ohio.
The actual data on daily COVID deaths do not show this, however. The graphic below illustrates this using data from the COVID Tracking Project. Even though Michigan’s neighboring states had different COVID policies and restrictions, Michigan had a similar death rate. Had Gov. Whitmer’s orders had as large of an effect as the U-M analysis claims, the state should have performed significantly better than these neighboring states. We didn’t — our daily death rate tracked closely with Indiana and nearly always exceeded Ohio’s.
There are more reasons to doubt the analysis’s assumption that Gov. Whitmer’s actions were solely responsible for the decrease in positive cases tracked by the state over this period. For example, state data provided by U-M show that the trend in daily new cases in Michigan started to decline before the “the pause” went into effect on Nov. 18. The seven-day average of new daily cases peaked on Nov. 14 and has fallen and remained below that level ever since.
Something other than “the pause” must explain this. This leaves open the possibility that cases would have continued to fall even without interventions. The U-M analysis is left claiming that cases fell at a faster rate than the downward pace they were already on.
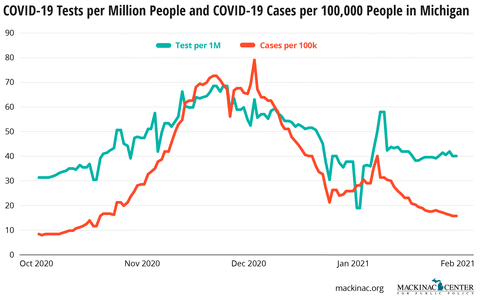
Another factor that probably led to fewer positive cases being reported, which the analysis does not appear to have considered, is the significant drop in testing over the period. According to state data provided by U-M, Michigan was administering over 60,000 tests per day when “the pause” went into effect on Nov. 18. That number started to fall around Thanksgiving and steadily decreased until the new year, when the state was only conducting about 33,000 tests per day. That’s a 45% decrease.
Administering fewer tests typically means fewer known cases, and this could explain a lot of the decline in positive cases since “the pause” began. Data from the COVID Tracking Project shows that testing volumes and the number of cases track closely with each other. The decline in cases in Michigan from the end of November to the end of December closely tracks the decline in testing, as Graphic 2 illustrates.[1]
Another problem with U-M's simulation model is that it treats “the pause” as a singular, consistent policy. It wasn’t. Gov. Whitmer and Robert Gordon, former director of the state health department, regularly tweaked the policy and gradually allowed certain activities to resume over the period the U-M study analyzes. There were really three different "pauses,” one from Nov. 18 to Dec. 8, another from Dec. 9 to Dec. 20 and a third from Dec. 21 to Jan. 15.
The first pause outlawed indoor dining, group fitness classes and all amateur and youth organized sports, closed bowling alleys, stadiums, movie theaters, casinos and skating rinks, and prohibited in-person schooling at high schools, colleges, career and technical schools and trade schools. But starting Dec. 9, skating rinks and outdoor group exercise were permitted to reopen at limited capacity, and in-person classes at career and technical schools and trade schools was permitted. Then on Dec. 21, movie theaters, casinos, stadiums and bowling alleys were allowed to reopen at limited capacity, noncontact sports were permitted outdoors, and high schools and colleges could once again meet in person.
The fact that case counts continued their downward trend despite these policy changes challenges the basic assumption built into the U-M simulation: The restrictions put in place by “the pause” were what drove down case counts. Even when restrictions were relaxed, the study assumes those actions reduced case counts as effectively as the initial restrictions did. It’s as if no matter what the state did — whether imposing new restrictions or lifting them — all of it “worked” equally well.
A last reason to be skeptical of this analysis is that the University of Michigan’s School of Public Health is not a neutral third party for the purpose of assessing the impacts of the state’s COVID response. Experts at the school have been advising Gov. Whitmer on what policies to enact throughout the pandemic, at times sharing a stage with her at press conferences. These same experts may have been involved in the decision to initiate the second shutdown starting Nov. 18. People advising the state on what action to take have a strong interest in showing that the actions they recommended were successful.
Careful analysis of the impact of COVID-related policies are valuable, and researchers across the globe are trying different ways to estimate the results of these extraordinary governmental actions. This recent U-M analysis is not one of those, however. By relying on faulty assumptions and ignoring relevant and important factors that may have contributed to falling case counts, it fails to prove anything about whether the governor’s decision to ban certain activities was responsible for slowing the spread of COVID-19 in Michigan.
[1] The graph uses different units for population controls for tests (per million) and cases (per 100,000) simply to make the trend lines easier to read.
Michigan Capitol Confidential is the news source produced by the Mackinac Center for Public Policy. Michigan Capitol Confidential reports with a free-market news perspective.
More From CapCon