

Michigan's 'Lost Decade' Was Historic
State suffered the fourth worst economic drop from 2000-2009 going back to the Great Depression


(In a Sept. 23 interview, the Democratic candidate for Lieutenant Governor, Lisa Brown, said “I think the Granholm years, you know, weren’t as bad as we think.” A Michigan Capitol Confidential series is examining how the state’s economy fared in its "lost decade.")
From 2000 to 2009, the income of Michigan residents plummeted to a degree experienced in only a handful of states since the Great Depression of the 1930s.
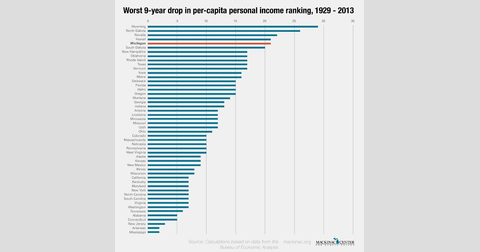
Per-capita personal income in the state fell from 18th highest in the U.S. in 2000 to 38th place in 2009; this relative decline was the fourth largest for any state during a nine-year period going back to 1929.
Michigan residents' earnings didn’t just drop compared to other states. When factoring in inflation and measured in constant 2013 dollars, per capita income was less in 2009 ($37,102) than in 2000 ($40,605), a decline of $3,502, or 8.6 percent. Nationwide, per capita income grew from $41,379 in 2000 to $42,736 in 2009, a 3.3 percent increase using 2013 dollars.
“Michigan’s experience is a very rare occurrence,” said James Hohman, assistant director of fiscal policy at the Mackinac Center for Public Policy, who performed the analysis.
Hohman said the dramatic drop began before Gov. Granholm took office in 2003 and lasted through 2009. Recovery began in 2010, which was Gov. Granholm’s final year in office.
The state’s auto manufacturing sector played a role. Michigan lost 219,000 “transportation equipment manufacturing” jobs from 2000 to 2009, about two-thirds of the state’s jobs in that category.
But the decline can’t all be pinned on the automobile industry, because overall Michigan lost 805,000 jobs in those nine years.
Hohman said Gov. Granholm’s approach to the problem didn’t help.
“Gov. Granholm’s economic initiatives were about taking money from all taxpayers and giving it to a favored few industries,” he said.
Michigan’s relative decline in personal income during the Granholm era was not the worst experienced by any state ever, however. From 1979 to 1988, the state of Wyoming dropped from 7th highest income to 36th. North Dakota fell 26 spots from 1973 to 1982 and Nevada dropped 22 spots from 2004 to 2013.
Michigan’s decline is tied with that experienced by Hawaii between 1992 and 2001, which fell from 5th to 26th place.
University of Michigan economist Don Grimes finds a silver lining in these plunges.
“These big movements in income relative to other states appear to reflect major structural changes in the economy and changes in the price of energy and agricultural products,” he said. “The most promising fact from this analysis, which corresponds to some of my research, is that these big changes in relative income are not necessarily permanent. States which have seen a big decline in income, like Michigan during the 2000s, frequently see a rebound the following decade. Michigan has out-performed the U.S. since 2009, and this analysis suggests that this relative trend might continue.”
From 2012 to 2013, Michigan’s per-capita personal income grew at the ninth-fastest rate in the country, increasing from $38,291 in 2012 to $39,215 in 2013, according to the Bureau of Economic Analysis at the U.S. Department of Commerce.
According to Hohman, the auto industry is less of a factor in the state’s economy than in the past. He said the industry accounted for one out of every 13.5 jobs in Michigan in 2000, while it’s just one in 24.5 jobs in 2014.
Michigan Capitol Confidential is the news source produced by the Mackinac Center for Public Policy. Michigan Capitol Confidential reports with a free-market news perspective.
 Michigan reading scores worse now than when Whitmer vowed to fix literacy crisis
 Legislators pitch funding grants for museum and log cabin
 Vance threatens Medicaid funding cuts as Michigan touts its anti-fraud record