Commentary
Schools That Beat the Odds Beyond Graduation
High school CAP Scores correspond with college enrollment rates

PxHere
Parents considering different high school options might look at a host of criteria to determine how well the school will help their teenager succeed. Graduation rates, standardized test scores and college enrollment rates all might make the list.
Still, individual metrics of school performance can be somewhat misleading on their face. Those metrics may better reflect other factors, particularly students’ socioeconomic status, rather than the quality of the school itself.
The Mackinac Center’s series of Context and Performance Report Cards have substantiated the well-known phenomenon that schools with poorer student populations tend to score lower on standardized tests. The connection can be clearly seen in comparing the rates of Michigan schools’ achievement rates on recent SAT and M-STEP tests with the shares of students receiving free lunch subsidies due to family poverty.
Lower-income schools also tend to see fewer of their students attend college, at either two- or four-year institutions:
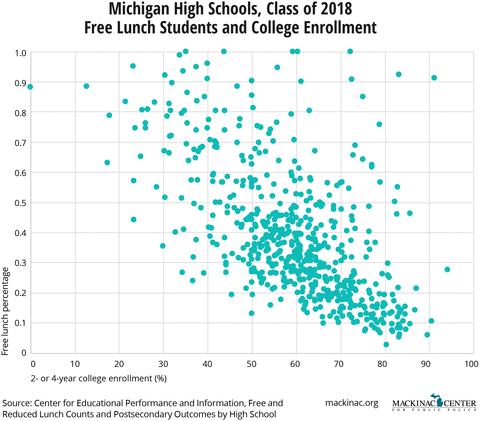
The average college enrollment rate across all high schools in Michigan is just over 59%. From high schools with 60% or more low-income students, less than 45% of graduates enroll in college. Among high schools where less than 40% of students are economically disadvantaged, the college enrollment rate is 65%. However, these averages do not tell the entire story of a school’s quality. As seen above, there are schools with poorer populations whose students attend college at higher rates, as well as those with fewer poor students whose college enrollment rate is lower than similarly situated schools.
This is where the Mackinac Center’s CAP Scores can be useful. The scores represent a very simple method of judging the relative quality of education at a school. It essentially asks: given the economic status of the students taking the standardized test, what should we expect those results to look like? A school that perfectly meets the expectation receives a score of 100. A score above 100 means it exceeds expectations, while one below 100 means it falls short.
If CAP Scores are helpful in gauging how well a school prepares its students for opportunities after high school, higher CAP Scores should also be associated with more students enrolling in college. That is indeed what we see:
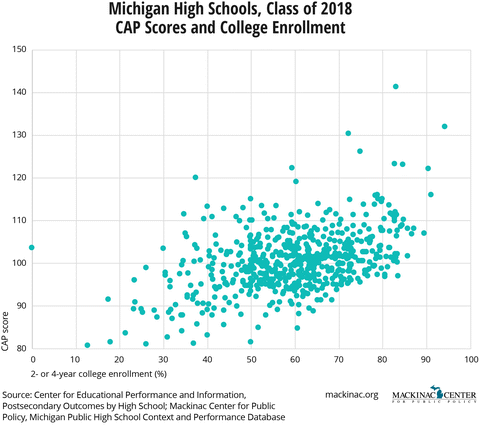
Schools with CAP Scores below 93 have a college enrollment rate of about 43%, and those with scores greater than 107 have an average enrollment rate of 68%. After controlling for students’ economic status, college attendance remains strongly connected with CAP Scores.[1] This holds true when looking just at schools with greater than 60% of their students eligible for free lunch. Among these schools, college attendance jumps from 36% for graduates from schools with CAP Scores below 93 to 58% for those scoring 107 or higher.
One final point of interest is that higher CAP Scores correlate positively with college enrollment even when considering low-income students on their own. The average school in Michigan sends economically disadvantaged students to college at a rate of approximately 50%. This drops to only 39% for high schools with less than a 93 CAP Score, but jumps to 61% those with a score of 107 or higher.
In other words, higher CAP Scores not only help parents find schools overcoming the odds on standardized achievement tests, they also indicate schools that do better equipping students for college, regardless of that student’s economic background.
[1] The CAP Scores are standardized to have a standard deviation of 15. I’m using 93 and 107 as thresholds simply because they are, rounded down, half a standard deviation away from the mean of 100.
 |
|

 Like CapCon on Facebook
 Follow CapCon on X
Schools That Beat the Odds Beyond Graduation
High school CAP Scores correspond with college enrollment rates
Parents considering different high school options might look at a host of criteria to determine how well the school will help their teenager succeed. Graduation rates, standardized test scores and college enrollment rates all might make the list.
Still, individual metrics of school performance can be somewhat misleading on their face. Those metrics may better reflect other factors, particularly students’ socioeconomic status, rather than the quality of the school itself.
The Mackinac Center’s series of Context and Performance Report Cards have substantiated the well-known phenomenon that schools with poorer student populations tend to score lower on standardized tests. The connection can be clearly seen in comparing the rates of Michigan schools’ achievement rates on recent SAT and M-STEP tests with the shares of students receiving free lunch subsidies due to family poverty.
Lower-income schools also tend to see fewer of their students attend college, at either two- or four-year institutions:
The average college enrollment rate across all high schools in Michigan is just over 59%. From high schools with 60% or more low-income students, less than 45% of graduates enroll in college. Among high schools where less than 40% of students are economically disadvantaged, the college enrollment rate is 65%. However, these averages do not tell the entire story of a school’s quality. As seen above, there are schools with poorer populations whose students attend college at higher rates, as well as those with fewer poor students whose college enrollment rate is lower than similarly situated schools.
This is where the Mackinac Center’s CAP Scores can be useful. The scores represent a very simple method of judging the relative quality of education at a school. It essentially asks: given the economic status of the students taking the standardized test, what should we expect those results to look like? A school that perfectly meets the expectation receives a score of 100. A score above 100 means it exceeds expectations, while one below 100 means it falls short.
If CAP Scores are helpful in gauging how well a school prepares its students for opportunities after high school, higher CAP Scores should also be associated with more students enrolling in college. That is indeed what we see:
Schools with CAP Scores below 93 have a college enrollment rate of about 43%, and those with scores greater than 107 have an average enrollment rate of 68%. After controlling for students’ economic status, college attendance remains strongly connected with CAP Scores.[1] This holds true when looking just at schools with greater than 60% of their students eligible for free lunch. Among these schools, college attendance jumps from 36% for graduates from schools with CAP Scores below 93 to 58% for those scoring 107 or higher.
One final point of interest is that higher CAP Scores correlate positively with college enrollment even when considering low-income students on their own. The average school in Michigan sends economically disadvantaged students to college at a rate of approximately 50%. This drops to only 39% for high schools with less than a 93 CAP Score, but jumps to 61% those with a score of 107 or higher.
In other words, higher CAP Scores not only help parents find schools overcoming the odds on standardized achievement tests, they also indicate schools that do better equipping students for college, regardless of that student’s economic background.
[1] The CAP Scores are standardized to have a standard deviation of 15. I’m using 93 and 107 as thresholds simply because they are, rounded down, half a standard deviation away from the mean of 100.
Michigan Capitol Confidential is the news source produced by the Mackinac Center for Public Policy. Michigan Capitol Confidential reports with a free-market news perspective.
More From CapCon