Commentary
MSU Report Distorts School Funding Picture
Education revenues on track, Michigan near middle of pack

PxHere
A new education funding report from Michigan State University made a splash in media outlets last week. Multiple headlines and stories declared the state in a freefall of dollars dedicated to Michigan's public schools. The real story is far less dramatic and devastating. In fact, Michigan ranks near the middle nationally in per-pupil funding.
While many of the report’s claims deserve close scrutiny, two widely touted claims in particular merit further investigation. First, the study reports that Michigan’s K-12 state funding dropped by nearly 30 percent between 2003 and 2015. Second, David Arsen, the lead author of the report, found that between 1995 and 2015, Michigan had the lowest school funding growth of any state.
These claims look different when calculating them in per-pupil terms, analyzing different time periods, and using more standard approaches to adjust for inflation. A more realistic and balanced picture of education funding is more likely to guide state leaders toward sound policy decisions.
Accounting for the number of students is crucial to any meaningful education funding calculation. Michigan’s enrollment peaked in 2002-03, so some level of reduced overall funding accompanying this decline should be expected. The number of public school students dropped by 12 percent over the next dozen years, explaining a sizable share of the 28 percent decrease in funding.
Next, the MSU report builds its calculations by comparing school costs to average local and state government spending growth, rather than to the consumer price index, which is based on the change in prices of a basket of goods that school employees (who account for 80 percent or more of school spending) and other taxpayers buy. The government price deflator used in the report makes the funding trend more drastic. Much of this can be explained by the fact that Michigan was in a one-state recession for a significant portion of the time period analyzed. While governments in other states were taking in more tax revenue and expending ever more resources, Michigan’s economy was shrinking quite dramatically.
Using instead a regional consumer price index that tracks metro Detroit area price changes over time, Michigan’s total, inflation-adjusted per-pupil revenues in 2015 were less than 1 percent below what they were in 2003 — definitely not a headline-worthy finding. The federal data source used by MSU researchers left out the same comprehensive financial data that’s available through 2017. Adding in those two extra years boosts total per-pupil revenues by another 4.7 percent above the regional CPI, which puts Michigan at its own all-time high.
Data from all other states is lacking to make this comparison through 2017, but finding a different starting point in the comparison can downplay the shocking headlines significantly. Comparing per-pupil funding changes from 1994-95 or 2002-03 does land Michigan near the bottom of the states.
But coming out of the Great Recession, which left an especially deep mark on the Great Lake State, Michigan ranks right near the middle: 25th among states in the last five years of per-pupil funding growth. As of 2015, Michigan similarly stands at 24th in the amount of K-12 revenues received: $12,649 per student, less than 2 percent below the national average.
The conclusion of the MSU report closely ties together Michigan’s near-last progress on NAEP math and reading achievement with the allegation of near-last funding growth. However, the states that increased funding the most didn’t improve their test scores more than the states that didn’t boost funding as much. In fact, extra funding effort by a state doesn’t seem to have any clear relationship with its ability to boost educational outcomes. The following chart compares spending increases to test improvements on a state-by-state basis.
Six of the top 10 states that improved their average test scores on the NAEP the most were among the 11 states with the smallest funding growth. Conversely, New York made the same progress as Michigan while revenues grew by nearly $10,000 a student, a 76 percent increase in raw dollars. Michigan’s unadjusted funding growth over the period was 26 percent.
These findings mirror what a 2016 Mackinac Center analysis found on a smaller scale. Multiple years of detailed school-level data found no relationship between additional spending by a school and better results on 27 of 28 different measures of achievement. As harsh as it sounds, more money doesn’t automatically translate into better educational outcomes.
The carefully constructed pieces of the new MSU report has sought to leave a stark impression on readers’ minds that Michigan school funding has experienced a freefall and its academic achievement has suffered a result.
But a closer look at the report’s selective methods and the comparison of spending and outcomes reveals a far less disturbing diagnosis. It also undercuts the notion that accelerating funding increases will provide the needed remedy.
 |
|

 Like CapCon on Facebook
 Follow CapCon on X
MSU Report Distorts School Funding Picture
Education revenues on track, Michigan near middle of pack
A new education funding report from Michigan State University made a splash in media outlets last week. Multiple headlines and stories declared the state in a freefall of dollars dedicated to Michigan's public schools. The real story is far less dramatic and devastating. In fact, Michigan ranks near the middle nationally in per-pupil funding.
While many of the report’s claims deserve close scrutiny, two widely touted claims in particular merit further investigation. First, the study reports that Michigan’s K-12 state funding dropped by nearly 30 percent between 2003 and 2015. Second, David Arsen, the lead author of the report, found that between 1995 and 2015, Michigan had the lowest school funding growth of any state.
These claims look different when calculating them in per-pupil terms, analyzing different time periods, and using more standard approaches to adjust for inflation. A more realistic and balanced picture of education funding is more likely to guide state leaders toward sound policy decisions.
Accounting for the number of students is crucial to any meaningful education funding calculation. Michigan’s enrollment peaked in 2002-03, so some level of reduced overall funding accompanying this decline should be expected. The number of public school students dropped by 12 percent over the next dozen years, explaining a sizable share of the 28 percent decrease in funding.
Next, the MSU report builds its calculations by comparing school costs to average local and state government spending growth, rather than to the consumer price index, which is based on the change in prices of a basket of goods that school employees (who account for 80 percent or more of school spending) and other taxpayers buy. The government price deflator used in the report makes the funding trend more drastic. Much of this can be explained by the fact that Michigan was in a one-state recession for a significant portion of the time period analyzed. While governments in other states were taking in more tax revenue and expending ever more resources, Michigan’s economy was shrinking quite dramatically.
Using instead a regional consumer price index that tracks metro Detroit area price changes over time, Michigan’s total, inflation-adjusted per-pupil revenues in 2015 were less than 1 percent below what they were in 2003 — definitely not a headline-worthy finding. The federal data source used by MSU researchers left out the same comprehensive financial data that’s available through 2017. Adding in those two extra years boosts total per-pupil revenues by another 4.7 percent above the regional CPI, which puts Michigan at its own all-time high.
Data from all other states is lacking to make this comparison through 2017, but finding a different starting point in the comparison can downplay the shocking headlines significantly. Comparing per-pupil funding changes from 1994-95 or 2002-03 does land Michigan near the bottom of the states.
But coming out of the Great Recession, which left an especially deep mark on the Great Lake State, Michigan ranks right near the middle: 25th among states in the last five years of per-pupil funding growth. As of 2015, Michigan similarly stands at 24th in the amount of K-12 revenues received: $12,649 per student, less than 2 percent below the national average.
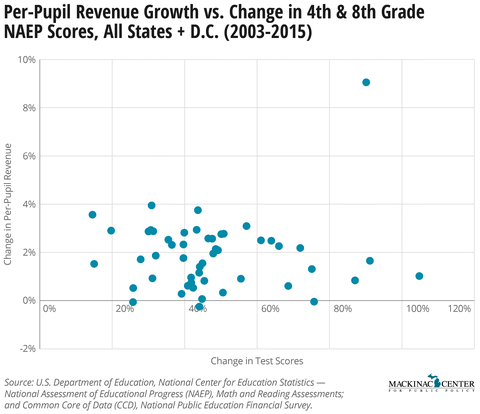
The conclusion of the MSU report closely ties together Michigan’s near-last progress on NAEP math and reading achievement with the allegation of near-last funding growth. However, the states that increased funding the most didn’t improve their test scores more than the states that didn’t boost funding as much. In fact, extra funding effort by a state doesn’t seem to have any clear relationship with its ability to boost educational outcomes. The following chart compares spending increases to test improvements on a state-by-state basis.
Six of the top 10 states that improved their average test scores on the NAEP the most were among the 11 states with the smallest funding growth. Conversely, New York made the same progress as Michigan while revenues grew by nearly $10,000 a student, a 76 percent increase in raw dollars. Michigan’s unadjusted funding growth over the period was 26 percent.
These findings mirror what a 2016 Mackinac Center analysis found on a smaller scale. Multiple years of detailed school-level data found no relationship between additional spending by a school and better results on 27 of 28 different measures of achievement. As harsh as it sounds, more money doesn’t automatically translate into better educational outcomes.
The carefully constructed pieces of the new MSU report has sought to leave a stark impression on readers’ minds that Michigan school funding has experienced a freefall and its academic achievement has suffered a result.
But a closer look at the report’s selective methods and the comparison of spending and outcomes reveals a far less disturbing diagnosis. It also undercuts the notion that accelerating funding increases will provide the needed remedy.
Michigan Capitol Confidential is the news source produced by the Mackinac Center for Public Policy. Michigan Capitol Confidential reports with a free-market news perspective.
More From CapCon